I Built vanilla-svg-chart at 4 AM in Bangkok: A Tiny SVG Chart Library Without Dependencies
At 4 AM in Bangkok, I made a decision.
I removed several chart libraries from my project and started writing my own lightweight SVG chart component.
The result is:
vanilla-svg-chartA tiny, dependency-free chart library built with pure JavaScript and SVG.
The goal was simple:
> Build a chart component that is fast, clean, transparent, and easy to maintain.
Why I Built Another Chart Library
Many developers may ask:
"Why create another chart library when there are already many mature solutions?"
The answer is simple:
Sometimes existing solutions are too complicated for a simple problem.
For example, a currency exchange rate page usually only needs:
- A smooth trend line
- Clear data points
- Mobile-friendly display
- Fast loading speed
However, adding a large visualization framework can introduce:
- Additional dependencies
- Larger bundle size
- More configuration
- More maintenance cost
For a simple financial data display, a lightweight solution is often better.
The Idea Behind vanilla-svg-chart
The philosophy is:
Keep the technology simple.Instead of relying on a large framework, vanilla-svg-chart uses:
- Native JavaScript
- Native SVG rendering
- Zero external dependencies
The browser already provides powerful graphics capabilities.
SVG is:
- Scalable
- Lightweight
- Supported everywhere
- Easy to debug
For line charts, SVG is more than enough.
Small Size, Fast Performance
One of the biggest advantages of vanilla-svg-chart is the extremely small size.
The entire library is only about:
12KB
No:
- Large JavaScript framework
- Extra plugins
- Heavy rendering engine
This makes it especially suitable for:
- Exchange rate websites
- Financial dashboards
- Personal projects
- Mobile web applications
Many online tools load slowly because they need to download large libraries before displaying simple information.
vanilla-svg-chart focuses on the opposite approach:
Open the page, display the data immediately.
Design Philosophy: Simple but Practical
The design was created from real usage scenarios.
For example, exchange rate charts need to show:
- Historical trends
- Current values
- Date changes
- Mobile compatibility
The design includes:
- Clear trend lines
- Balanced data labels
- Horizontal value display
- Mobile landscape guidance
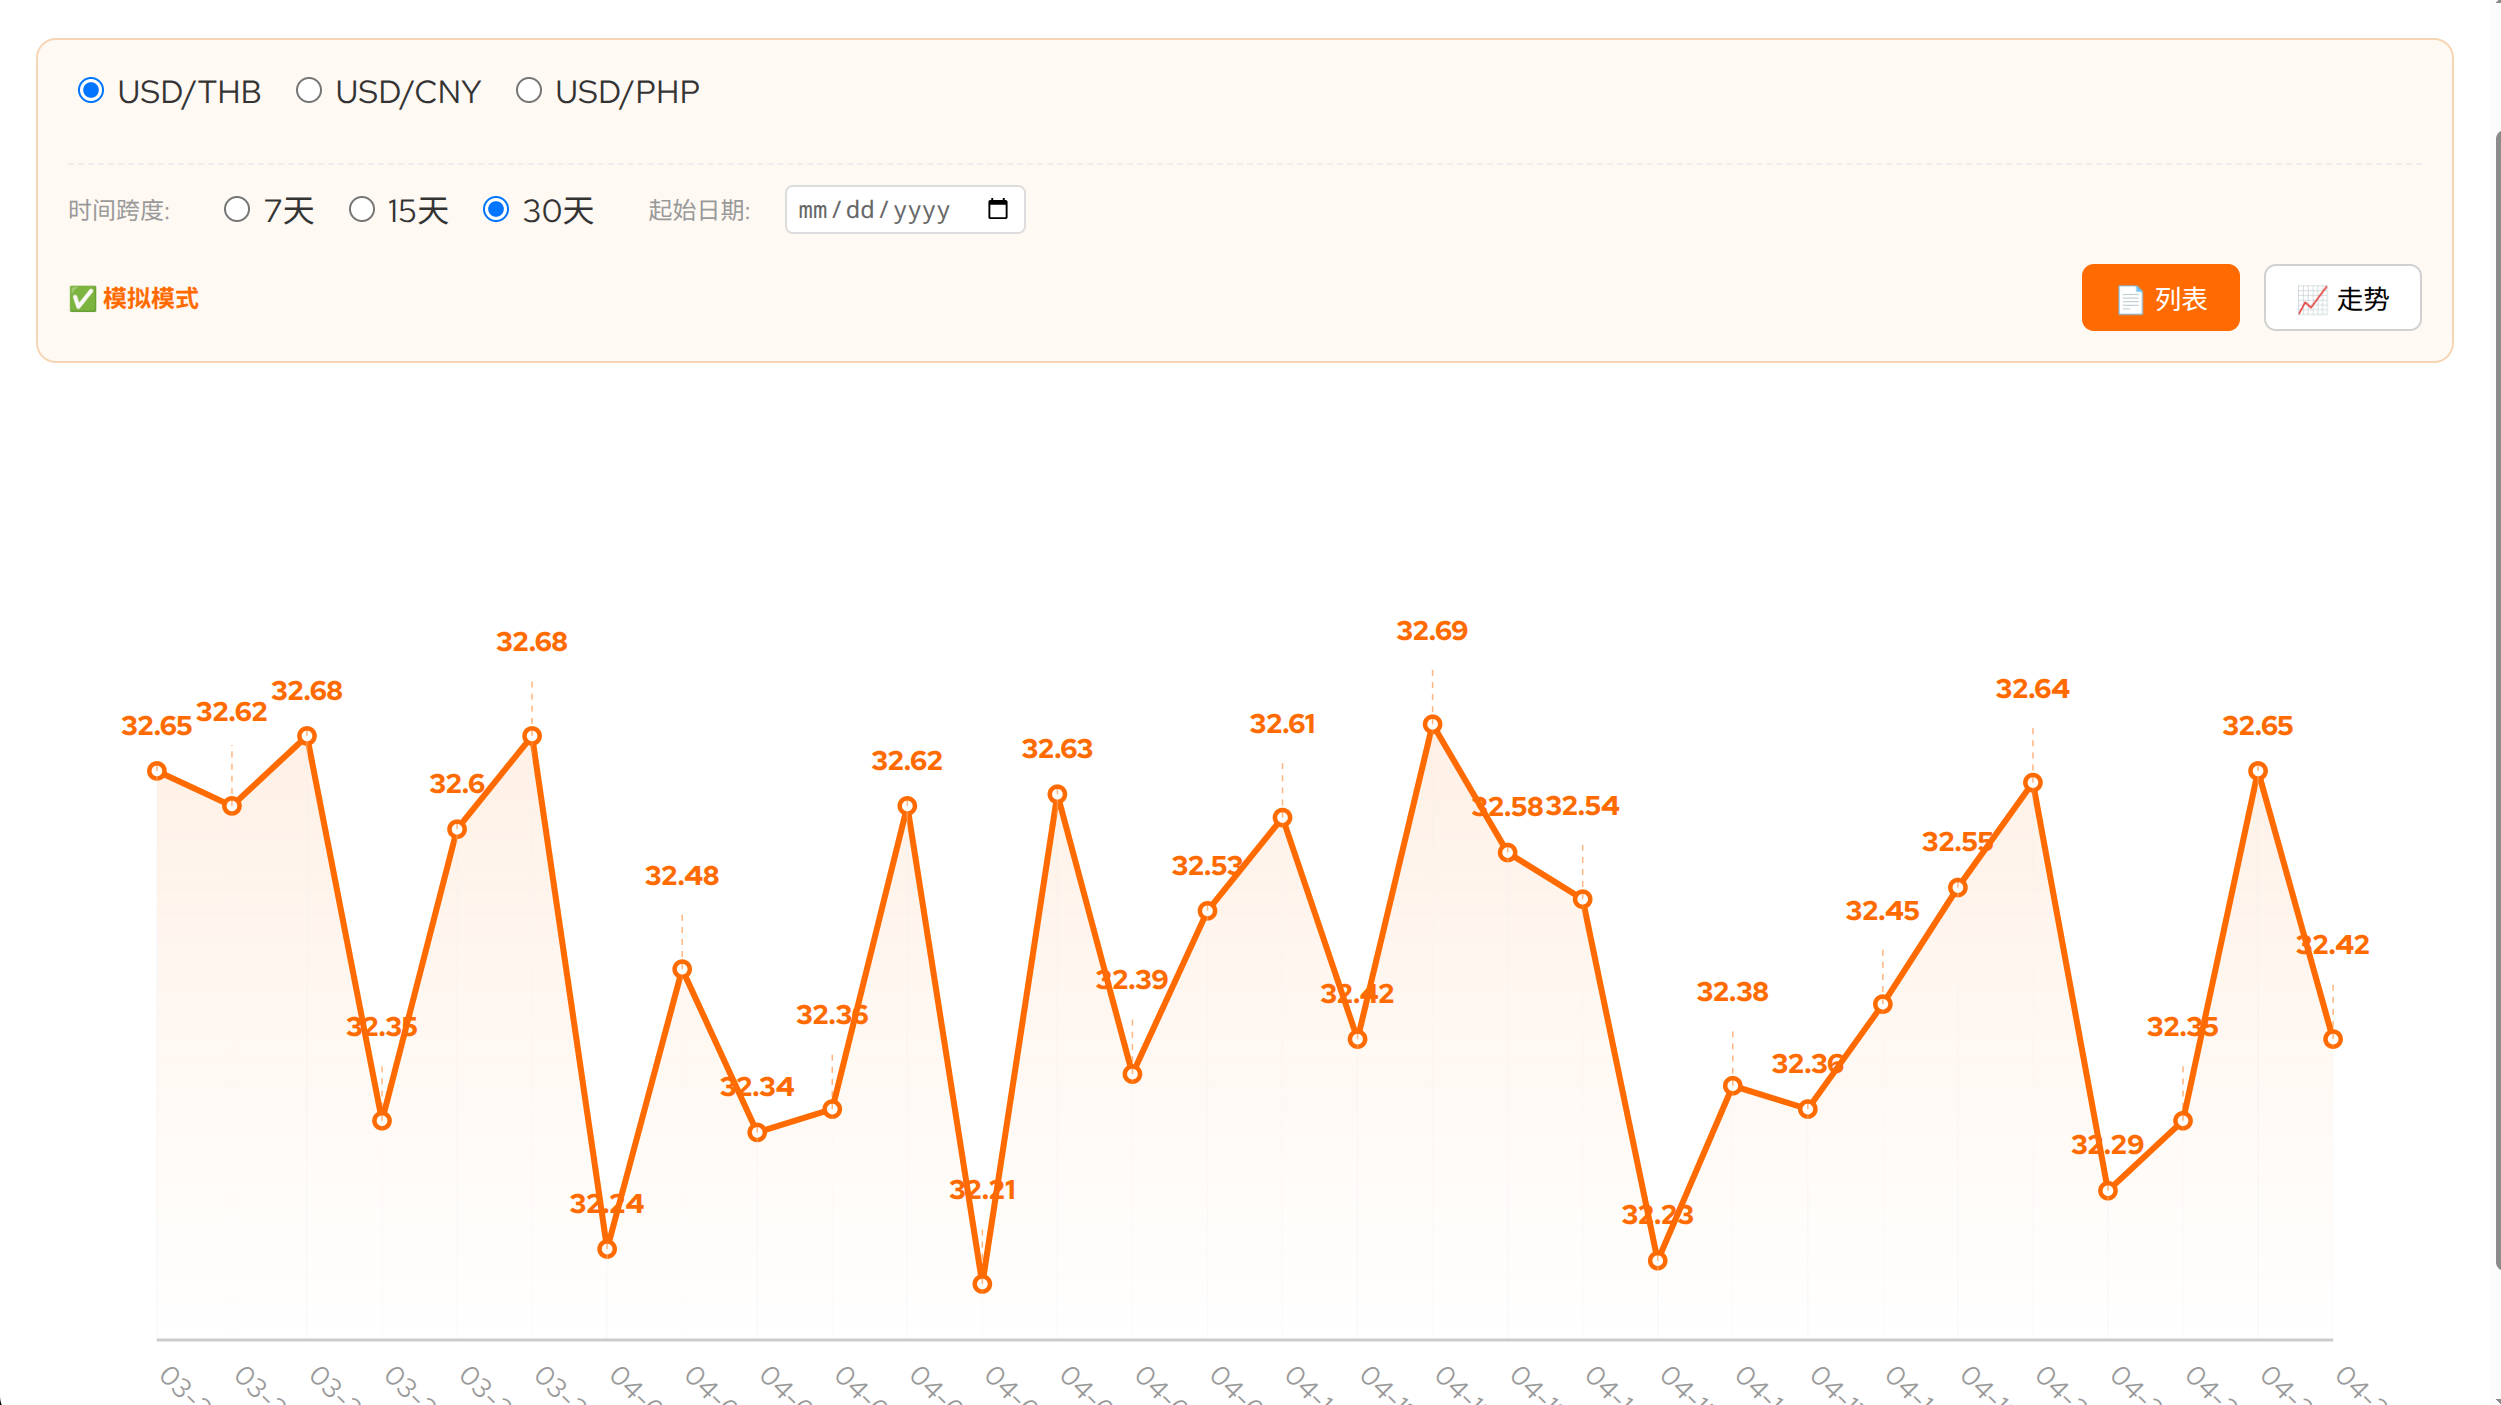
The goal is not to create a complicated visualization platform.
The goal is to make the information understandable quickly.
Data Transparency
Another important design principle is transparency.
The chart is only a visualization layer.
The actual data comes from:
- Manual verification
- Automated collection
- Historical records
The chart should help users understand data, not hide the data behind complicated systems.
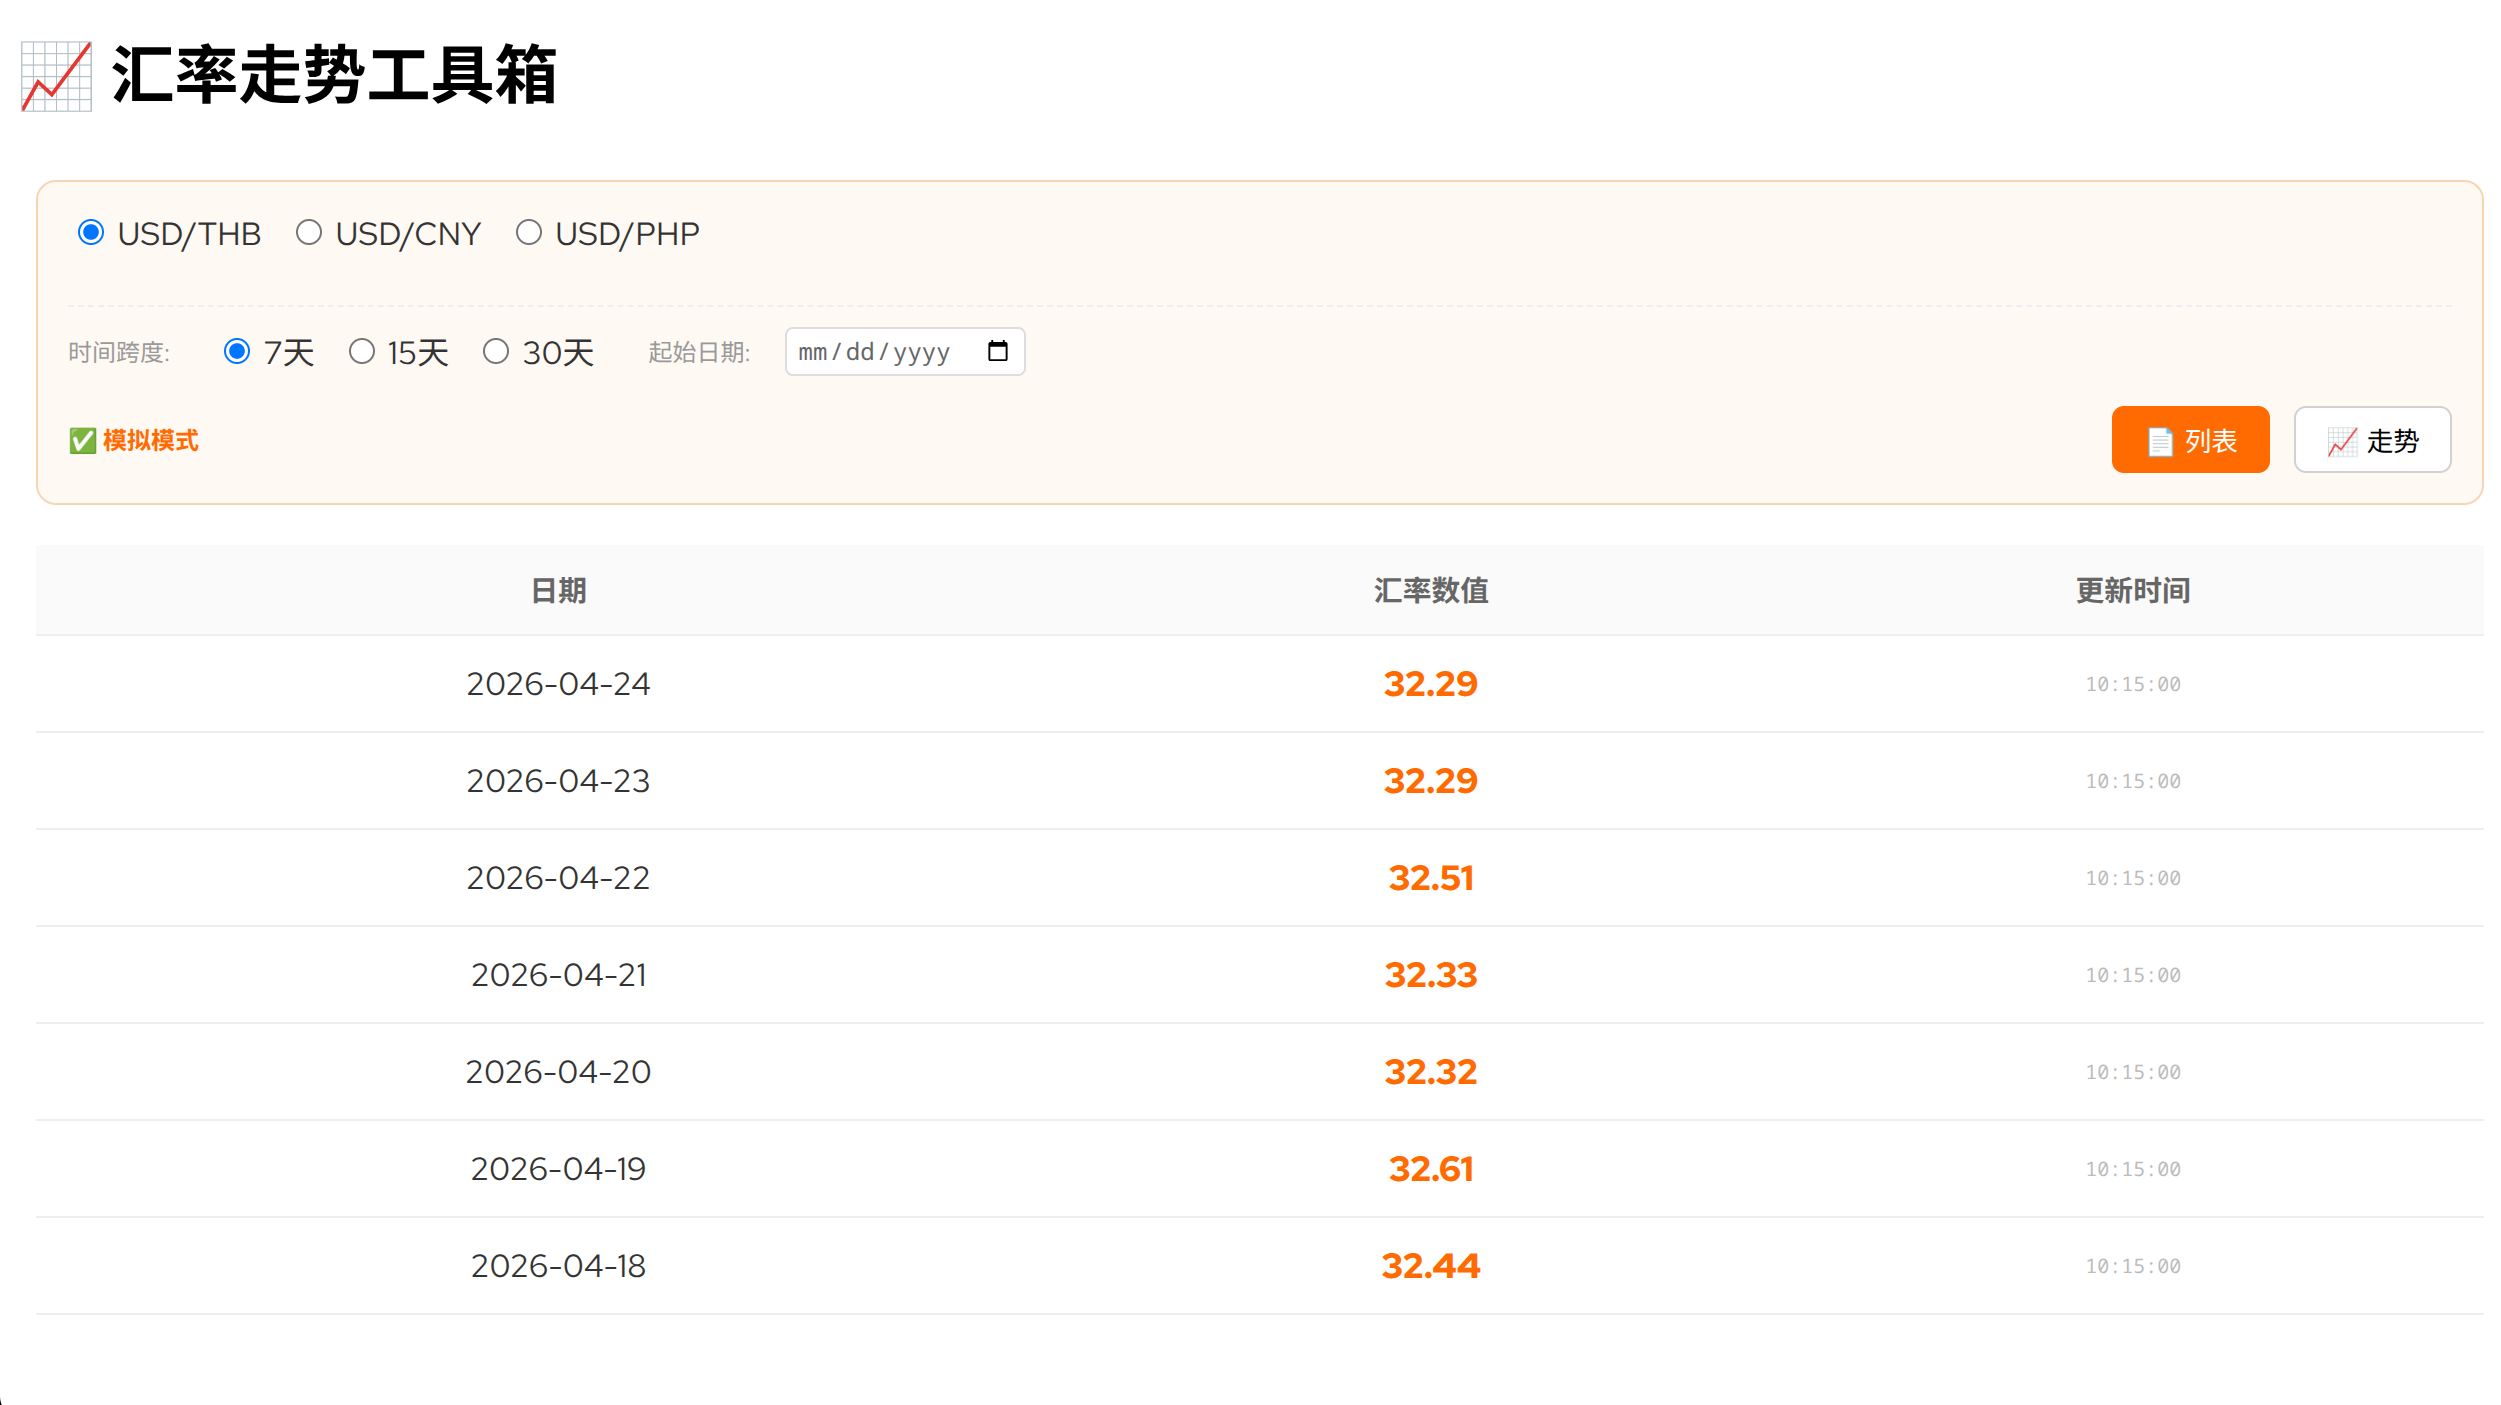
A simple chart with reliable data is often more valuable than a beautiful but unclear visualization.
Mobile First Design
Modern users access websites mostly through mobile devices.
A chart component should:
- Load quickly
- Use little memory
- Work smoothly on small screens
Heavy chart frameworks may be acceptable for large enterprise applications.
But for lightweight websites and personal projects, simplicity provides better results.
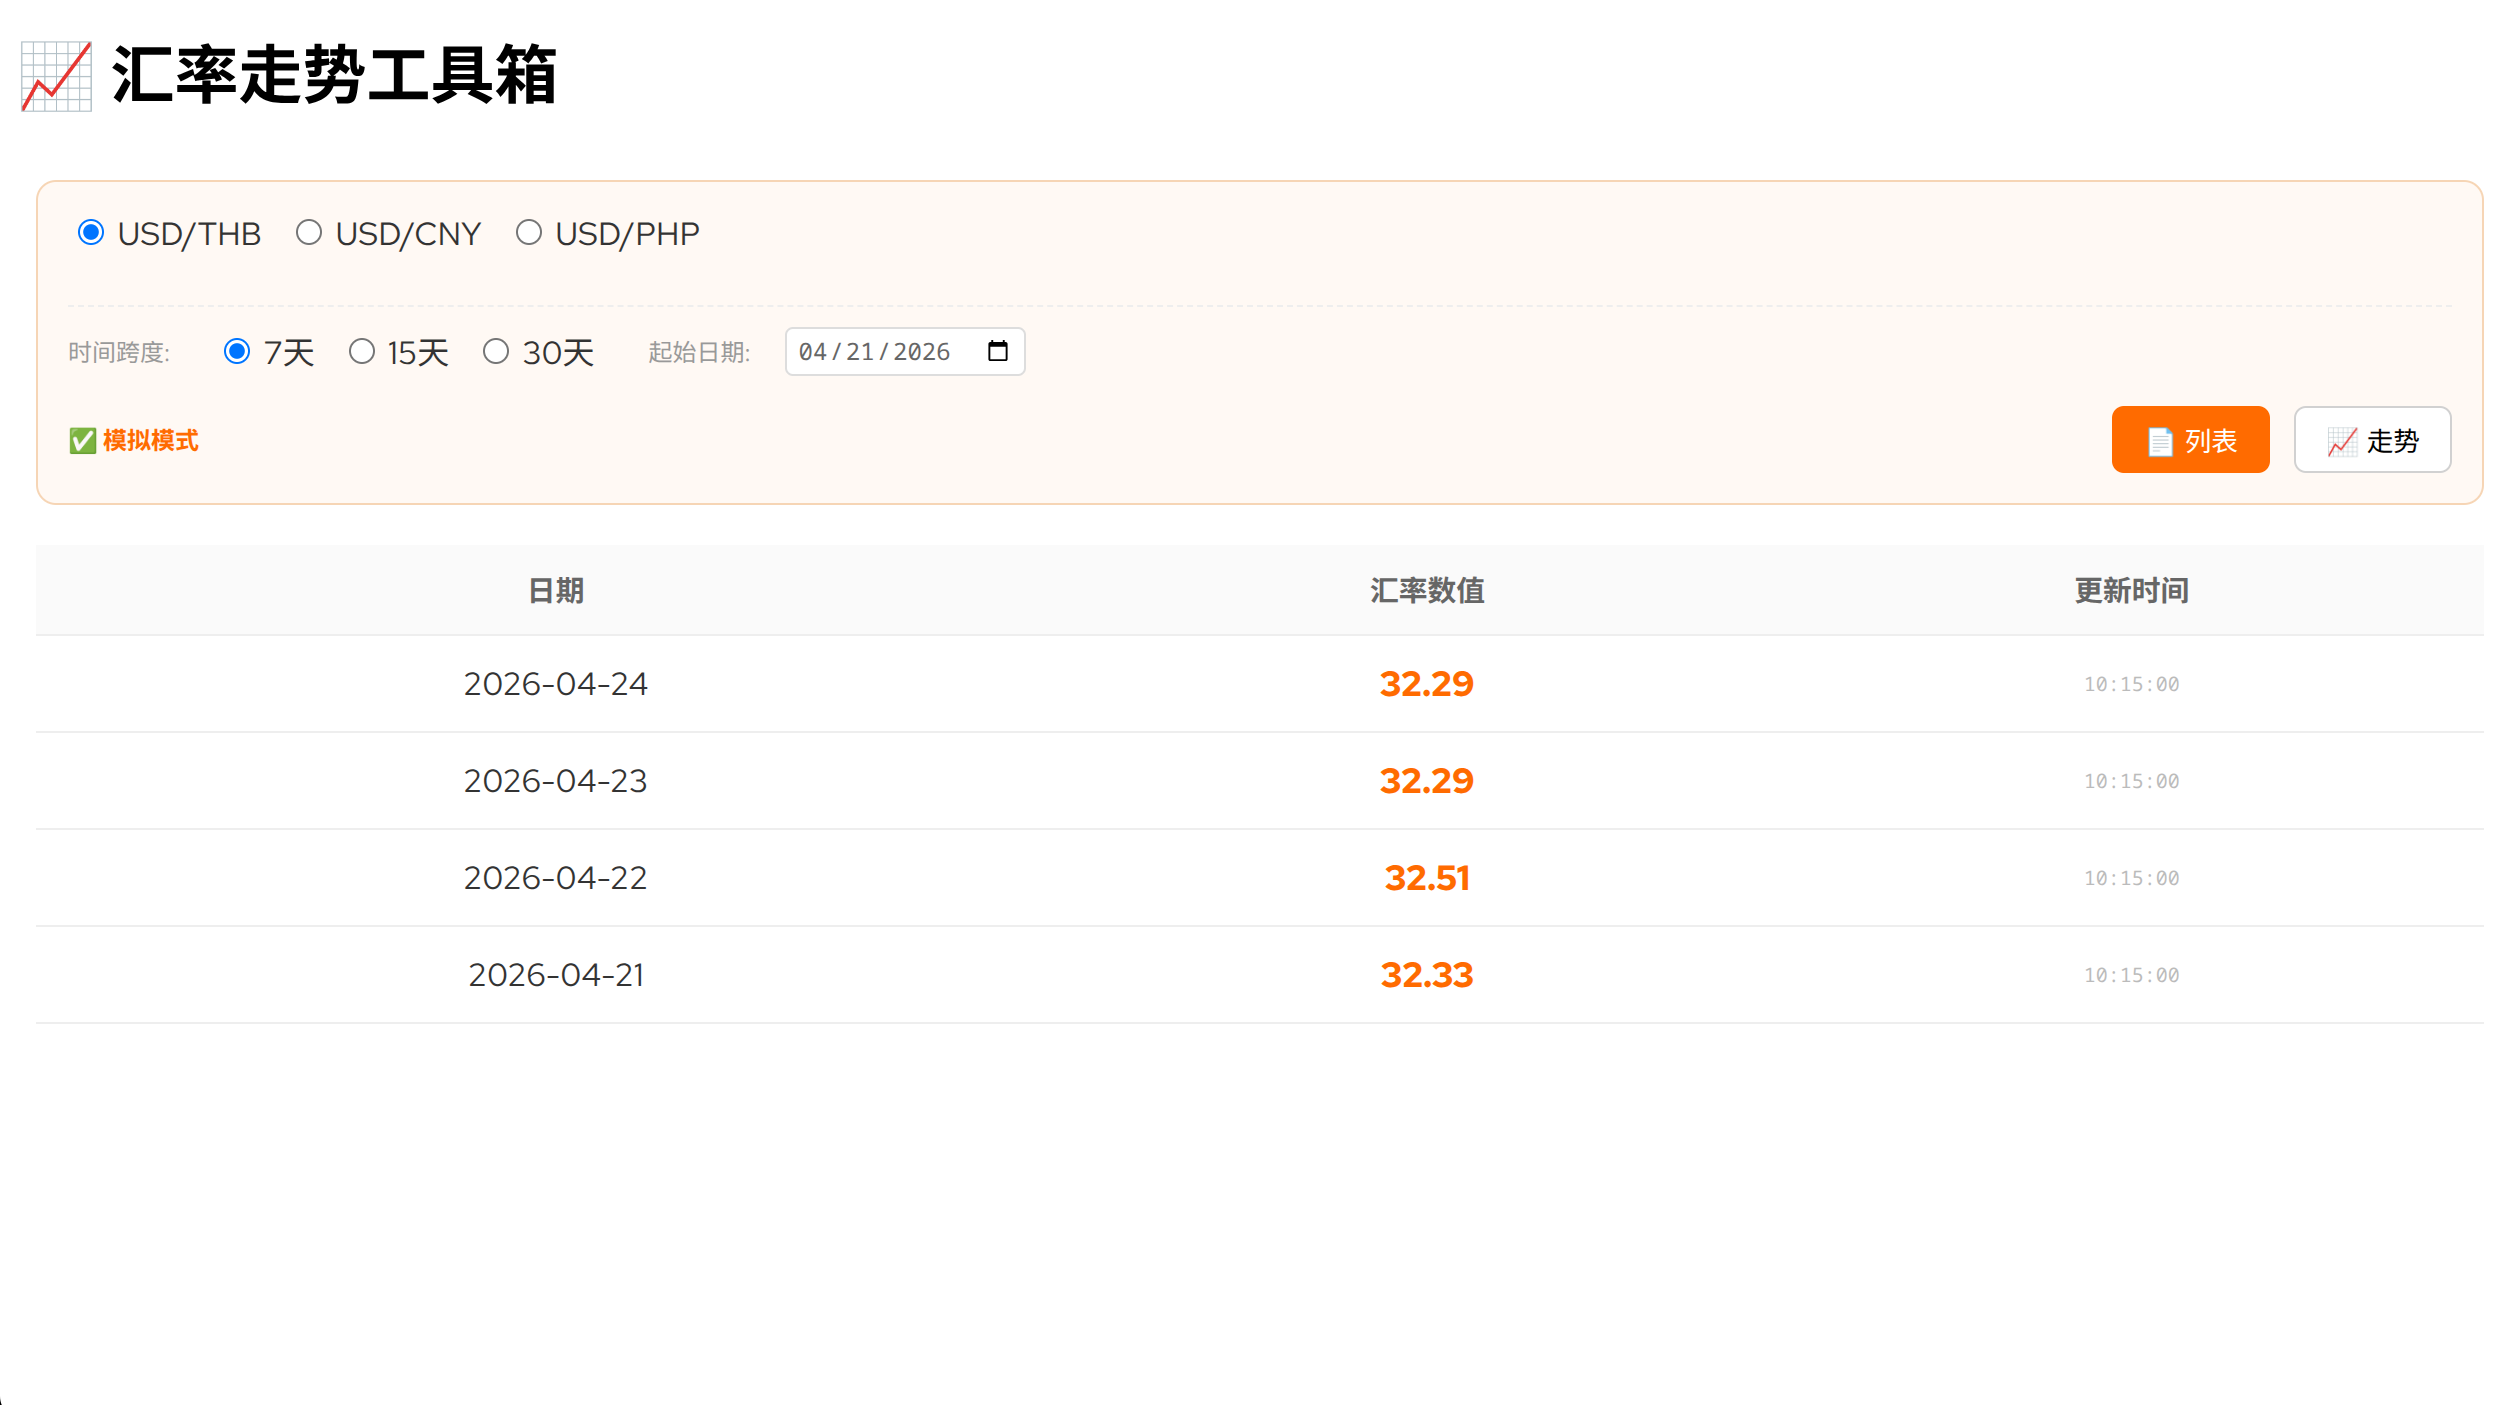
The chart automatically adapts to different screen sizes.
Users can quickly check trends without waiting for unnecessary resources.
Why Native SVG Is Still Powerful
Sometimes developers forget how capable modern browsers are.
Native Web technologies already provide:
- SVG graphics
- Canvas rendering
- CSS animation
- JavaScript interaction
Not every problem requires a large framework.
A small, well-designed native solution can sometimes be:
- Faster
- Easier to understand
- Easier to maintain
This is the same philosophy behind many open-source projects:
Use the simplest tool that solves the problem.
Open Source Project
vanilla-svg-chart is available on GitHub:
https://github.com/pixel-jey/vanilla-svg-chart
The project is designed for developers who prefer:
- Lightweight solutions
- Clean code
- No unnecessary dependencies
- Full control over their applications
Final Thoughts
Technology does not always need to become more complicated.
Sometimes the best solution is returning to the basics.
A few lines of native code can solve problems that previously required large libraries.
vanilla-svg-chart is a small project, but it represents an important idea:
Simple, fast, transparent, and reliable software is still valuable in the modern web era.Explore More
› How to Clear All Notifications on GNOME 50 Without Extensions
› My First Week Living in Bangkok: Excitement, Confusion, and Lessons I Didn't Expect
› My First Condo in Bangkok: How It Was Completely Different From the One I Had in the Philippines
› What I Learned Renting a Condo in Thailand: Mistakes, Costs, and Lessons From Bangkok
› How to Travel from Bangkok to Penang by Train (2026 Border Crossing & DTV Guide)